Finding The Next Outsiders
- Johann Colloredo-Mansfeld
- Oct 1, 2024
- 5 min read
Accounting data and statistical models can help separate wheat from chaff when it comes to picking the right platform for capital allocation
In “The Outsiders”, author William Thorndike profiles 8 CEOs who deliver extraordinary results for shareholders. Rather than focus on driving top-line growth, these CEOs obsessed over capital allocation. By rigorously evaluating tradeoffs among investing in growth, reducing debt, repurchasing shares, and engaging in acquisitions, these CEOs eschewed the conventional wisdom that profits should primarily be reinvested into growing revenues and expanding operations. As a result, their companies delivered benchmark-shattering performance.
So how can we find companies today that are bound for this elite circle of performance? Certainly, the managers of these firms played a very important role in allocating capital within their firms. But it is also probable that the businesses these CEOs ran had characteristics that facilitated capital allocation. These characteristics likely span several dimensions, but here I focus on what can be learned from the swath of accounting data available on public companies. By using a large sample of businesses, their returns, and contemporaneous accounting fundamentals, I seek to identify the pre-conditions that drive capital allocation. Analyses reveal several key variables that meaningfully predict a company’s ability to pay-down debt, buy-back shares, utilize assets, and engage in acquisitions and improve our ability to identify businesses that can most effectively allocate capital.
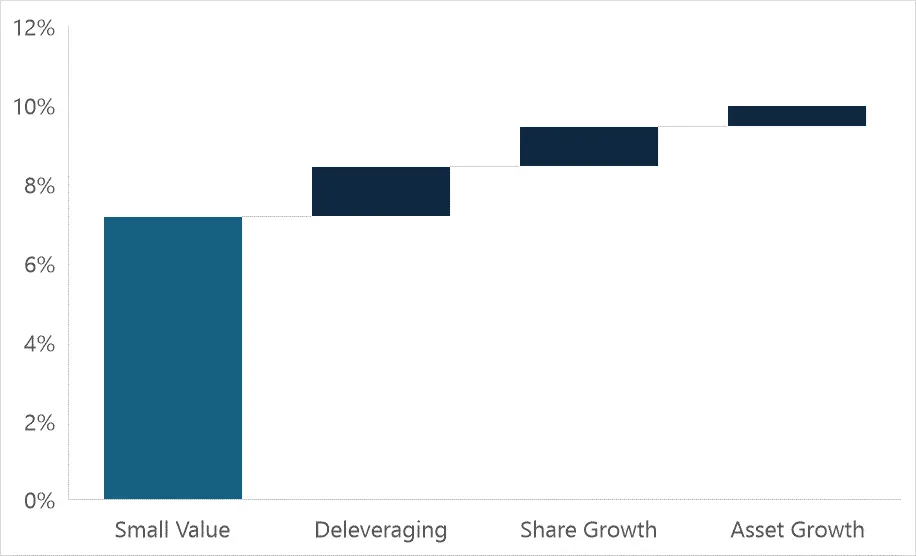
I previously wrote that managers who are active in allocating capital can play a prominent role in increasing shareholder returns. Key activities include paying down debt, buying back shares, and limiting asset growth. The data in Figure 1 show that these efforts help drive up to 2.8% in incremental average annual returns for small value investors. Underwriting businesses with a full understanding of how their accounting characteristics predispose them to these value-creating activities would appear critical.
Figure 1: Return Attribution to Capital Allocation, 2002 – 2022

Source: CRSP Compustat, Countervail Analysis
Perhaps the simplest model for understanding a company’s ability to allocate capital is to assess their current allocation practices and then assume that behavior will persist. For instance, it seems reasonable to assume that if a business is buying back shares this quarter, it would be more likely than not to buy back shares next quarter. Figure 2 stylizes this relationship across each of our key target variables (clockwise from top left): change in long-term debt, change in total assets, change in common shares outstanding, and change in goodwill. The butterfly-shaped distribution exhibited by the data highlights how companies can quickly change their policies from period to period. Anecdotally, this makes sense, a company may lever up to finance an acquisition in one period and then switch to paying down that balance in the next period.
Figure 2: Simple Lagged Model for Forecasting Changes in Target Variables

Source: CRSP Compustat, Countervail Analysis
Note: Target variables are plotted and analyzed by taking the log of the absolute value of the annual change while preserving the original signed change (increase vs. decrease)
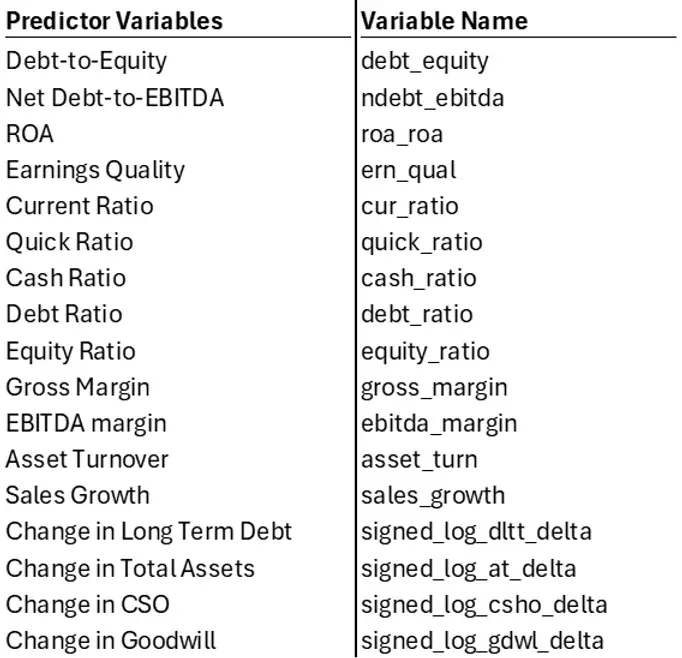
Making forecasts on this one variable alone wouldn’t get us very far: data appear to indicate for instance that a company decreasing leverage this period is roughly equally likely to continue decreasing leverage as they are to increase leverage in the following period. Improving our odds of generating an accurate forecast requires building a set of models that incorporate a range of relevant accounting data and synthesize this information in a way that generalizes well to unseen data. Using 585,159 observations on 6,350 unique companies between 2002-2022, I construct a dataset for this task. Figure 3 summarizes the variables I use to predict future changes in each of the target variables.
Figure 3: Summary of Predictor Variables and Naming Conventions

Source: CRSP Compustat, Countervail Analysis
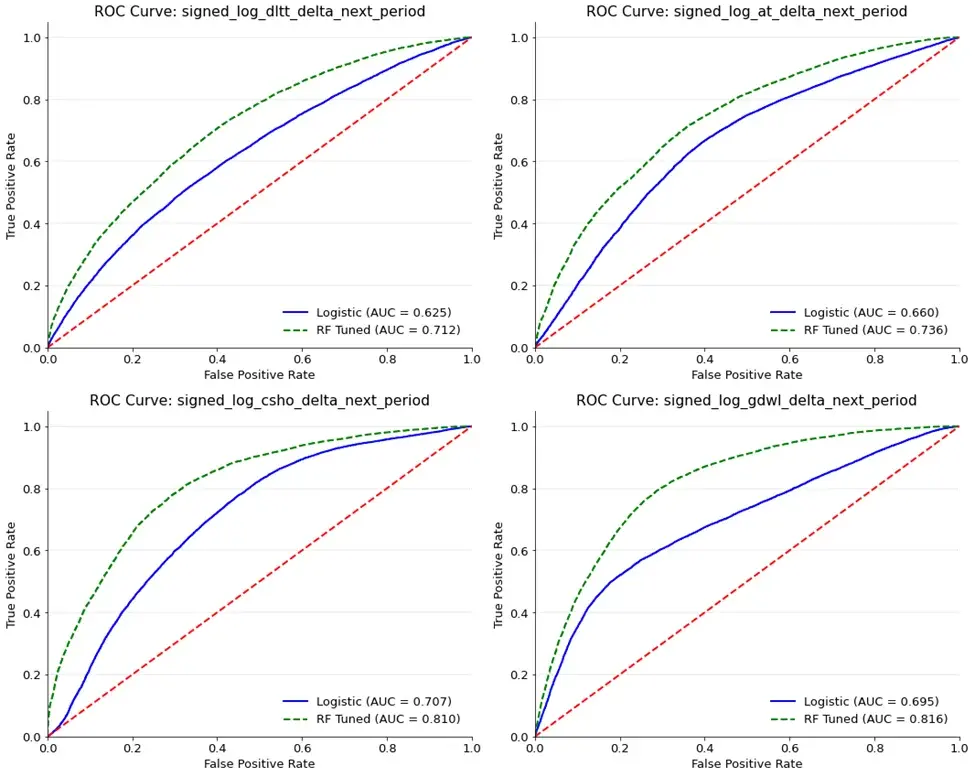
Using this data, I train and validate two models – a logistic model and a random forest model – to identify which variables and combinations of variables most accurately predict future changes in our target variables. In both instances, the model attempts to assign a probability that the target variable will increase or decrease, i.e. that long-term debt will increase or decrease next period (my business alma mater has researched this specific problem extensively). The models assign this probability for every company at every period across each of our target capital allocation variables. I follow the conventional approach in prediction modeling by holding out some portion of the data (20%) to validate the models’ performance on unseen data.
Figure 4 below appears complicated, but the takeaways are simple. The plots show the Receiver Operating Characteristic Curve (ROC) for each of these models. These curves help us visualize the predictive performance of the models on the 20% of data previously unseen by the models. A model that fails to meaningfully differentiate between next period's increases and decreases would follow the red dotted line, which plots the path of random guessing. As each curve bends further to the top-left corner of each plot, it indicates an improvement in our ability to accurately forecast changes in the underlying variables relative to random guessing. In all four instances both the predictive models are better than random guessing, and the random forest model consistently achieves better performance than does the logistic regression model. In predicting changes in debt, our model is 21.2% better than random guessing; in predicting changes in total assets, our model is 23.6% better than random guessing; in predicting changes in common shares outstanding our model is 31.0% better than random guessing; and in predicting changes in goodwill our model is 31.6% better than random guessing.
Figure 4: ROC Curves and Out of Sample Performance of Trained Models

Source: CRSP Compustat, Countervail Analysis
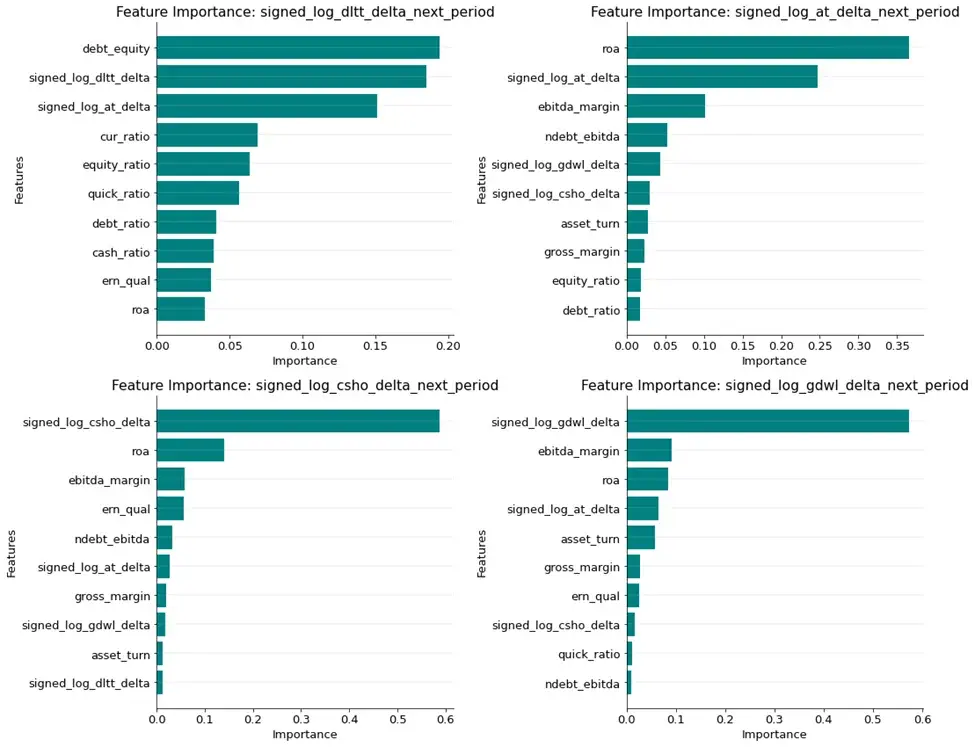
The data show that these models, and the random forest model in particular, have the potential to offer an edge in forecasting which companies are capable of pursuing capital discipline. A drawback, however, is that these approaches lack some interpretability. Random forests in particular leverage a structure that finds non-linear relationships among our set of predictor variables. We can see which variables the model deems important, but have a weaker understanding of how the model is using them. Figure 5 highlights which variables the random forest model weights most heavily in forecasting each of the change in long-term debt, the change in assets, the change in shares outstanding, and the change in goodwill.
For forecasting changes in long-term debt, the debt-equity ratio, the previous period change in debt, and previous period change in total assets are the three most important variables. For forecasting changes in assets, ROA, the previous change in total assets, and EBITDA margin are the three most important variables. For forecasting changes in common shares outstanding, the previous change in shares outstanding, ROA, and EBITDA margin are the three most important variables. For forecasting changes in goodwill, the previous change in goodwill, EBITDA margins, and ROA are the three most important variables.
Figure 5: Random Forest Variable Importance by Target Variable

Source: CRSP Compustat, Countervail Analysis
Investing is not strictly a science – and complex models should always be viewed with some level of skepticism. But these results offer a reasonable starting point for more fundamentally oriented selection. Data show that we can meaningfully improve the odds of selecting the right platform for capital allocation. Finding the next Henry Singleton or Katharine Graham becomes more likely when you start from a constrained universe of companies that have the preconditions where these super-star mangers can thrive.
Disclaimer:
The information provided in this research report is for informational purposes only and should not be construed as financial, legal, or investment advice. The opinions expressed herein are based on the author's analysis and should not be relied upon as a specific recommendation to buy or sell securities or other financial instruments. Readers are encouraged to conduct their own due diligence or consult with a qualified financial advisor before making any investment decisions. Countervail Capital and the author assumes no liability for any losses incurred based on the information provided in this report.


